layline.io Blog
Sniffing Real-Time Data
It's hard to understand what's actually happening in complex processing scenarios. layline.io helps by providing probing tools to get insights into inner workings of complex Workflows at runtime.
Reading time: 5 min.
The challenge of debugging data in complex processing streams
The world uses the notion of Workflows to define complex processing scenarios. One of the characteristics of such Workflows is, that they can be very complex in that they contain many steps (processes) which are interconnected based on various conditions.
Data traverses these Workflows, triggers actions and is pushed further along based on its content and state, among other things. The more complex a Workflow and the data traversing it, the harder it is to spot issues within the Workflow and the data, which may lead to undesired outcomes.
Pretty much all such systems, are black boxes in the way they process information. You can look at the input, see what’s coming out the other side and try to understand what happened in between. You may also be able to add debug-output statements in the code to capture snapshots of data in order to get to the bottom of things, or outright dump all data to a log and then try to browse through it and connect the dots.
All of this, is just a major pain, frustrating and very time-consuming. There has to be a better way.
Sniffing data in layline.io Workflows
Instead of making the Workflow spit out debug information, a smarter approach would be to treat the Workflow more like a computer network. Monitoring data in computer networks is non-invasive in that data is probed (“sniffed”) while traversing the network. In other words: It travels freely, but is picked up at points of interest, for further analysis without disturbance of the flow.
layline.io works the same way. It supports probing individual workflows for data while they are fully running their tasks. Below we will explain how this works and take a look at the advantages.
Starting a Sniffer Session
Probes are initiated and their results viewed through the web-based Configuration Center. Probes can be started on any running Workflow. To do so, head over to “/Operations —> Audit Trail/”. You will see a tab which says “Sniffer Sessions” (1↓) which is what we will use:
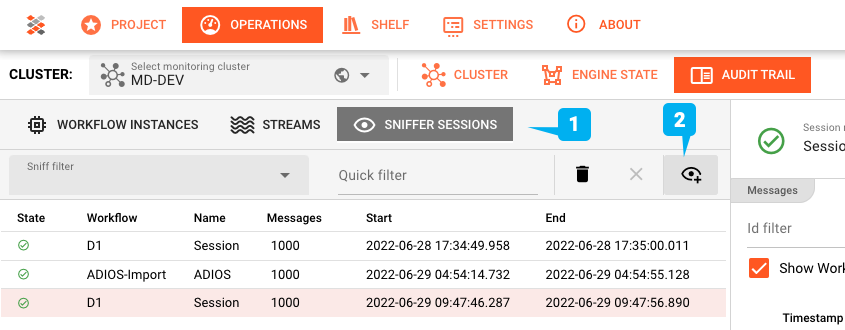
Sniffer Sessions - as the name implies - open a session which collects data and then closes it after a predefined volume and/or time. The results of the session are persisted, and you can take your time to then analyse the results.
To start a new sniffer session, you need to click on the little eye button to the right (2↑). This will bring up a dialog which helps you to define a new sniffer session:
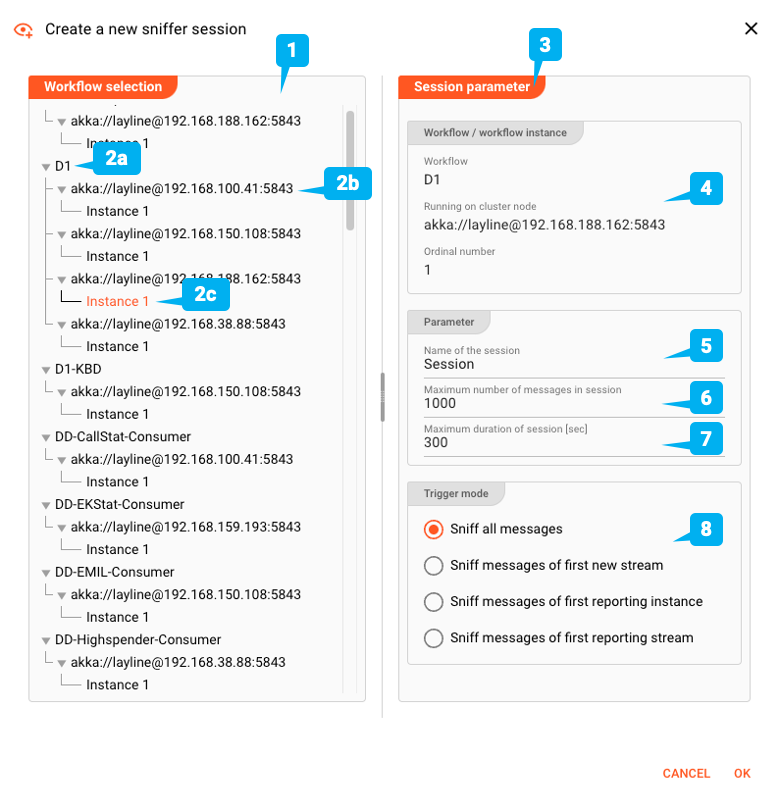
Pick Workflow
On the left we can pick a Workflow from all running Workflows. Choices are:
- Generally (2a↑): Probe Workflow regardless where it is running
- Node level (2b↑): Probe Workflow running on specific node
- Instance level (2c↑): Probe Workflow specific instance of Workflow running on specific node
This gives us granular control from where exactly we want to sniff data. Imagine running a specific Workflow on multiple nodes and instances, but only one of those instances seems to have issues. Here you can specify that you only want to sniff data from that particular instance instead of any Workflow instance.
Parameters
On the right we have the Session Parameters (3↑). In (4↑) we see what we picked from the left. We can then add parameters like an individual name for the session (5↑), set the maximum number of messages we want to probe for (6↑), as well as set a time limit for how long we want to listen for data in seconds (7↑).
Trigger
Last not least we can define when sniffing shall be started. You can either instantly start sniffing any message that flies by, or only start whenever a new stream starts, or from the first instance which responds, etc.
Sniffer Execution
Once you hit “OK” on the dialog, sniffing will commence. An open sniffer session will be created, waiting for data. Depending on your previous settings, the session will remain open until either the desired number of messages has been probed or the max-duration threshold has been reached.


As messages roll in, their meta-data are listed on the right-hand side of the Sniffer window with the most recent on the top (1↓). This contains information like the time, type of messages, where it was sniffed (instance), the name of the stream, and very importantly where in the workflow it was probed (location).
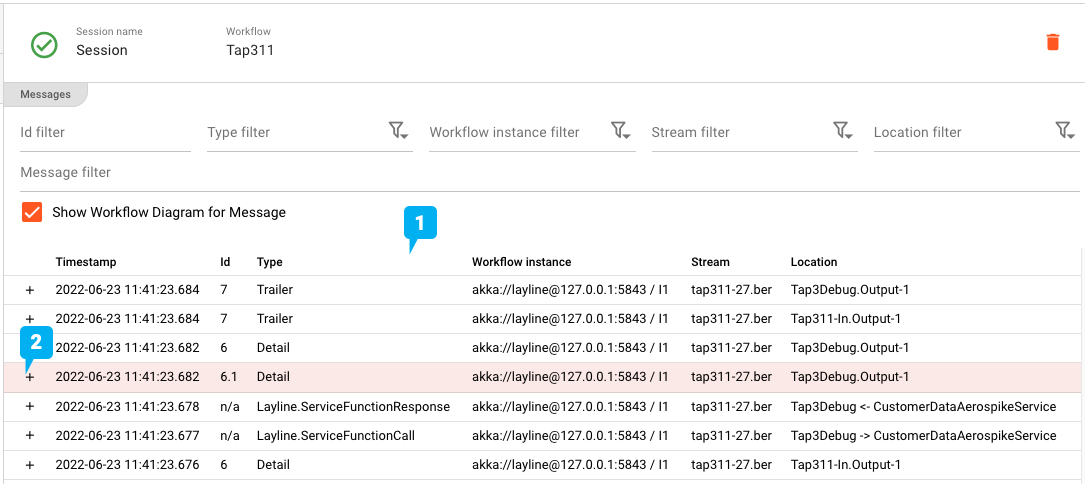
You may ask yourself from where in the Workflow messages are taken. As we can imagine, message content is prone to being modified as it traverses the Workflow’s processors. So where is the best place to probe for data? At the beginning, then end, somewhere in the middle? The answer is, on every connecting “line” in a Workflow. This is again analogous to network sniffing, where you don’t sniff in computers, but rather “on the wire” between computers.
layline.io likewise sniffs the same message on all connecting wires of a Workflow, which allows you to follow a message from beginning to end as it passes through the Workflow.
Analysis
When selecting a message from the result list, its position from where it was sniffed will be displayed in the Workflow graph at the bottom section of the window (3↓). Just check for the orange dotted line. Selecting the same message in other locations on the list will show it in other locations in the Workflow graph. This allows you to actually check a message in all of its stages or processing and compare potential changes to the same message.
Last not least we would like to know what’s inside the message. For this purpose click the “+” sign at the beginning of the message (2↑ or 1↓) to unfold the message structure and see all data contained (2↓).
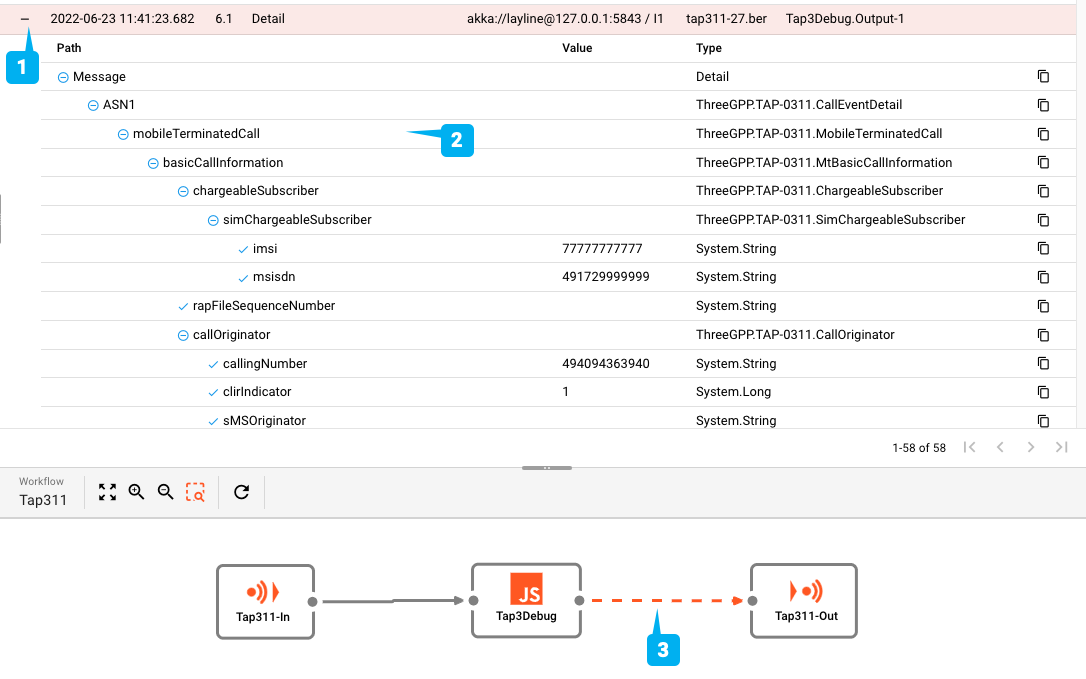
Notice that the probing data is persisted. This is really convenient in case you are running a number of probes on the same Workflow and want to compare results between multiple sniffer sessions.
Summary
A usually cumbersome task of debugging and probing data from millions of messages is made super simple with layline.io. Like in a production line for coal, you can simply grab some from the conveyor belt as it flies by, and analyse it without disturbance of the manufacturing process.
Pretty cool.
Resources
- Read more about layline.io here.
- Contact us at hello@layline.io.